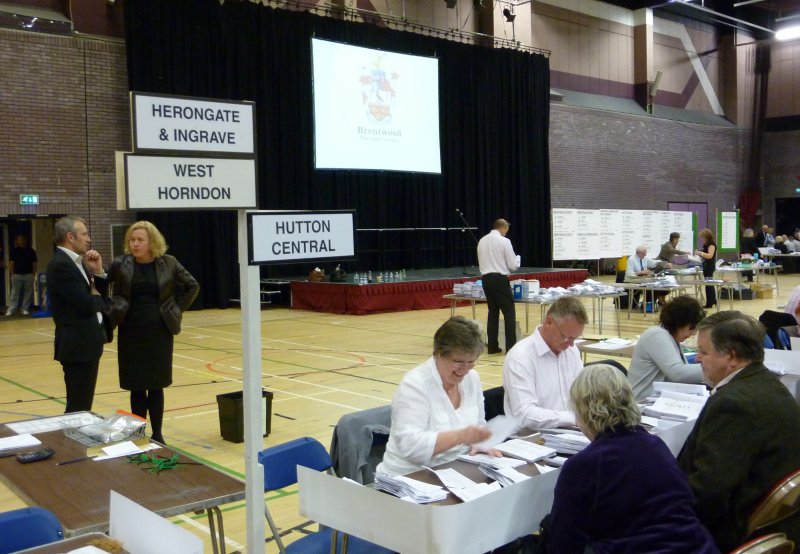
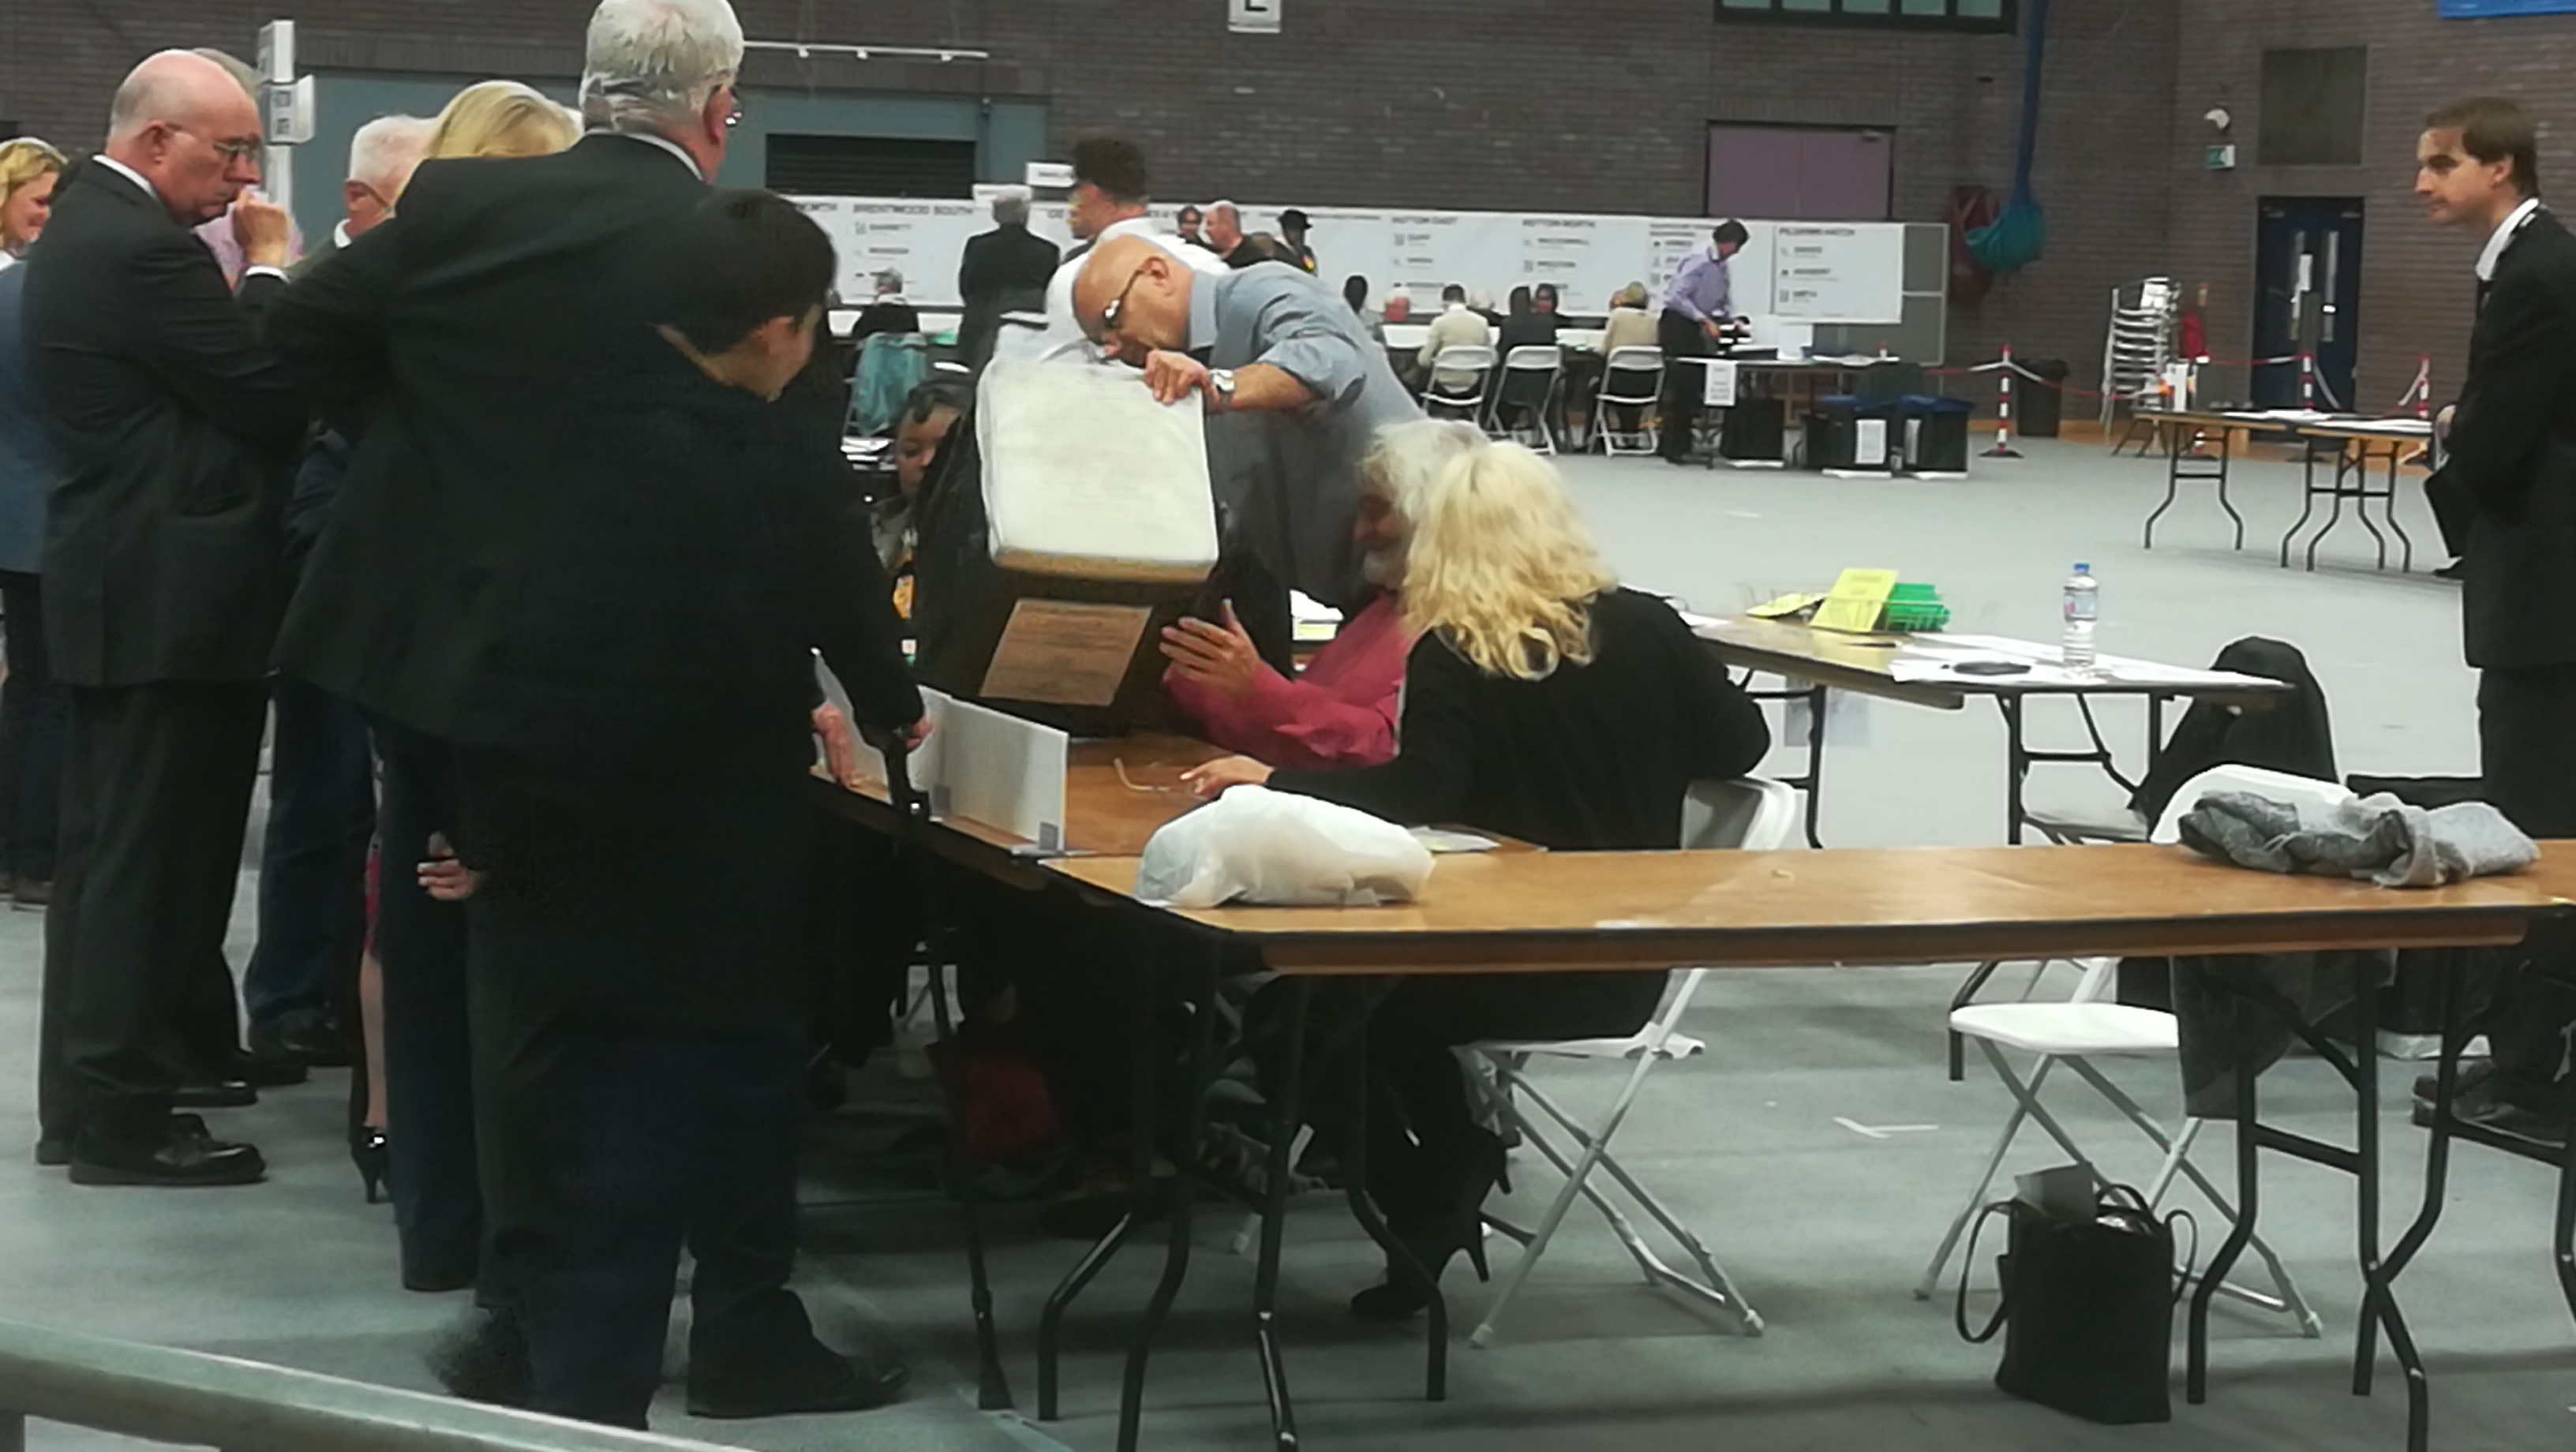
There were no changes in the County Council elections in Brentwood with the Conservatives and Liberal Democrats retaining their seats.
UKIP took 25.7% of the Brentwood vote – in line with their performance in the rest of the UK – but were unable to make any gains in Brentwood.
The Conservatives held on to Brentwood Hutton and Brentwood Rural with decreased majorities, holding on from UKIP in second place. The Liberal Democrats held Brentwood North and Brentwood South with increased majorities over the Conservatives but, like the Conservatives, lost share of the vote.
Labour increased its share marginally taking 9.1% of the Brentwood vote with the Greens taking 3.0%.
The Conservatives held on to their two seats in Billericay and Burstead too, with UKIP second and Labour improving from 2009 with a third place showing.
UKIP won a seat in Wickford Crouch and in Basildon Westley Heights, where their candidate Kerry Smith beat the Conservatives to first place.
The Conservatives held on to their majority on Essex County Council, although this was slashed to just 9 seats from their previous majority of 45. The Conservatives lost 18 and Liberal Democrats 3, with UKIP winning 9, Labour 8, The Greens 2 and two seats going to Independent/Residents Association candidates.
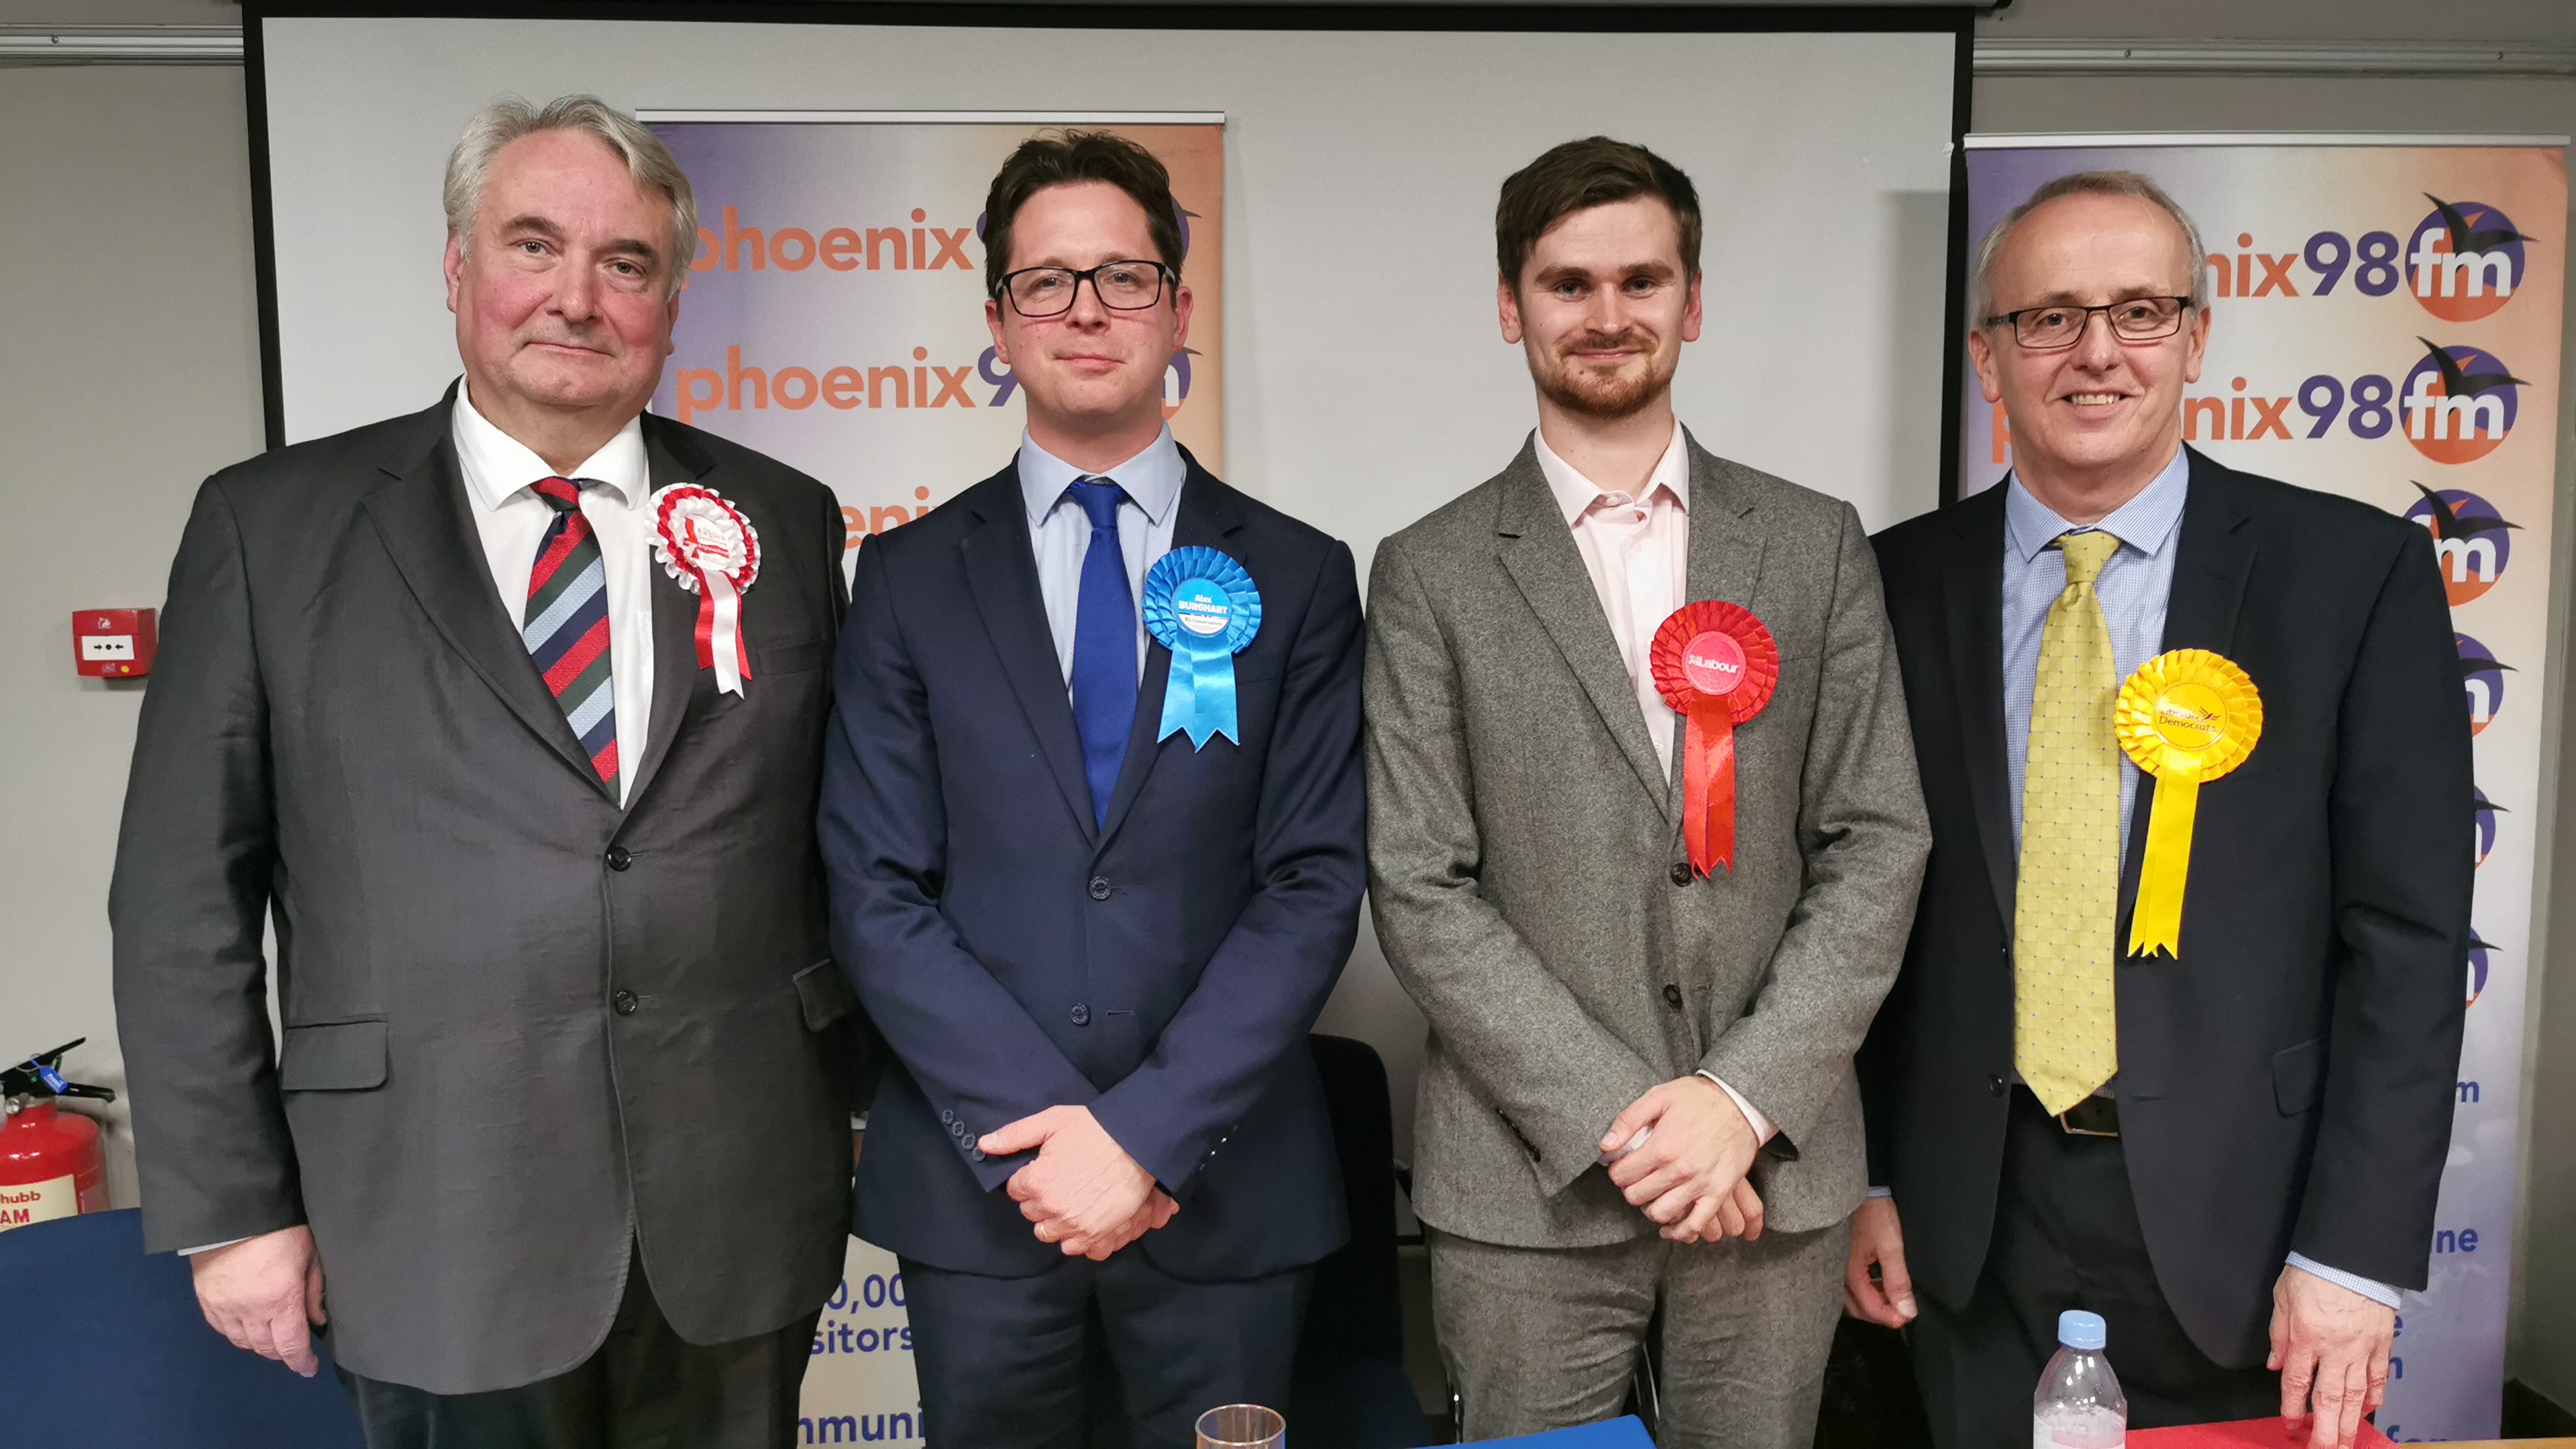
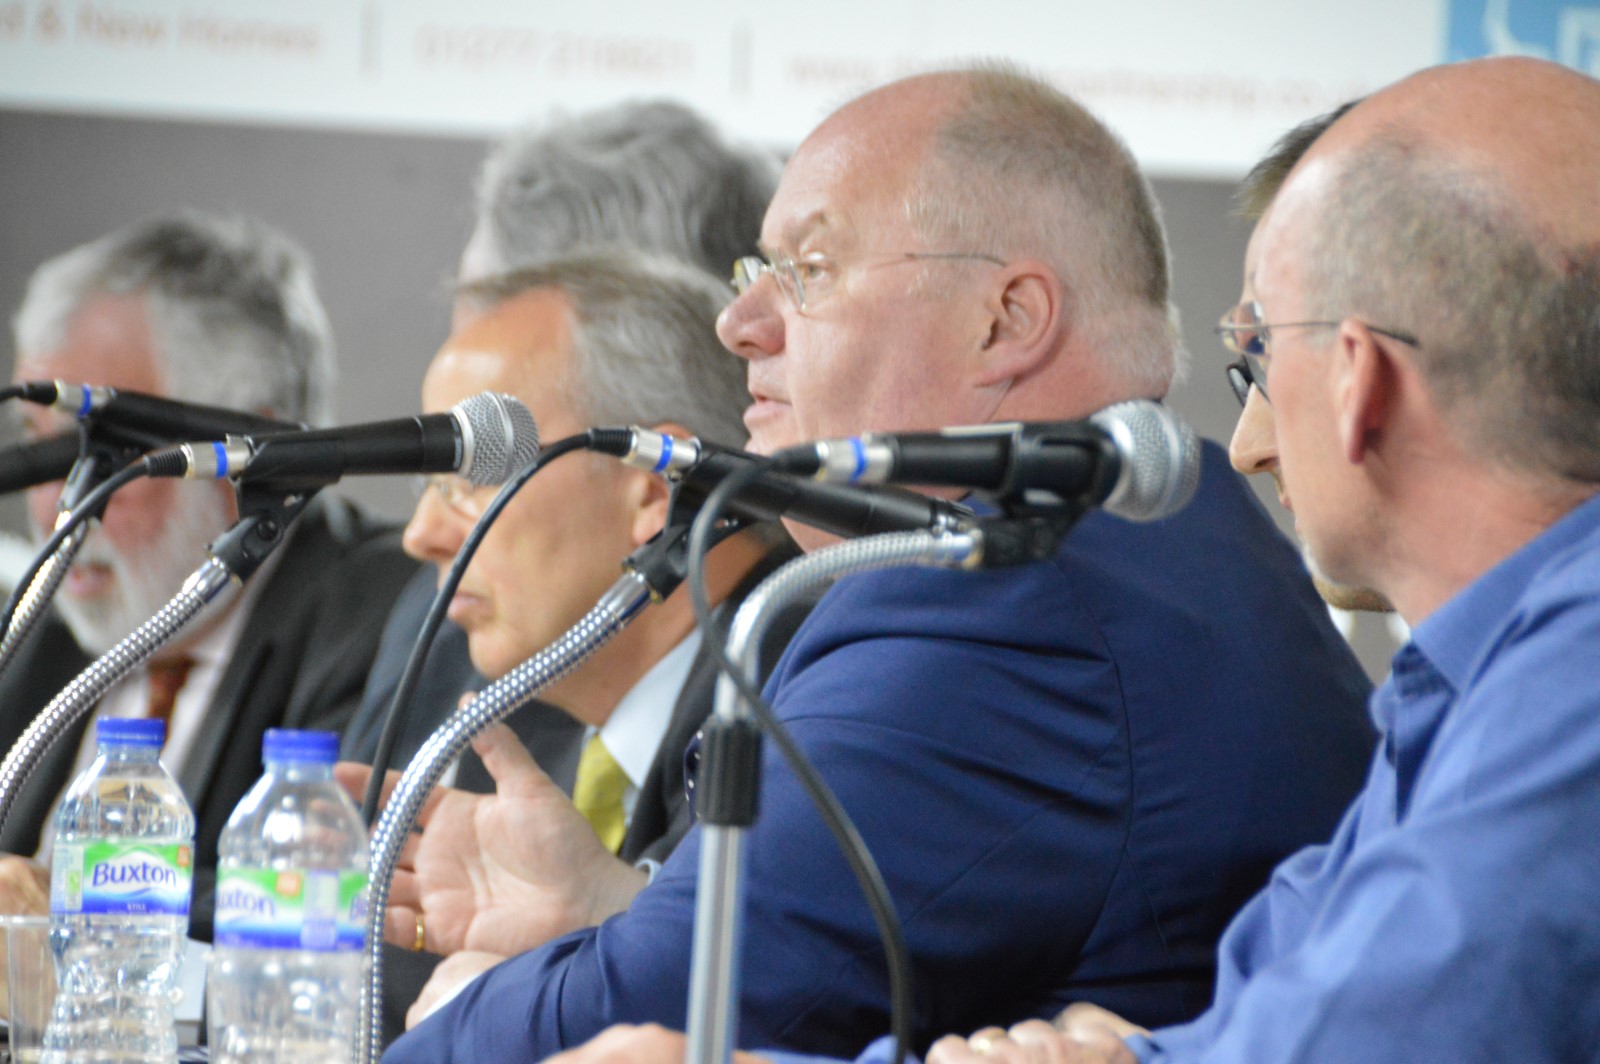
Before the first result was declared we caught up with candidates from each of the 4 main parties standing in the Brentwood area, together with the leader of the Borough Council, Louise McKinlay. To listen again click the buttons below:
 Mick McGough (UKIP, Brentwood North)[audio:https://www.phoenixfm.com/wp-content/uploads/2013/05/Mick-McGough.mp3|titles=Mick McGough]
 Mike Le-Surf (Labour, Brentwood Hutton)[audio:https://www.phoenixfm.com/wp-content/uploads/2013/05/Mike-Le-Surf.mp3|titles=Mike Le-Surf]
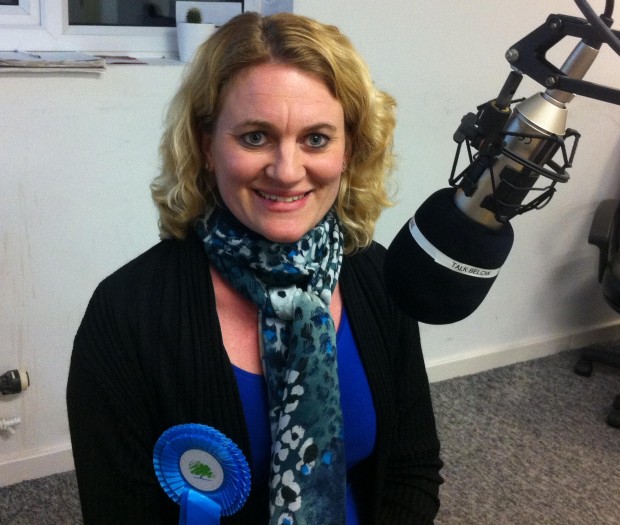 Cllr Louise McKinlay (Conservative, Leader of Brentwood Borough Council)[audio:https://www.phoenixfm.com/wp-content/uploads/2013/05/Louise-McKinlay.mp3|titles=Louise McKinlay]
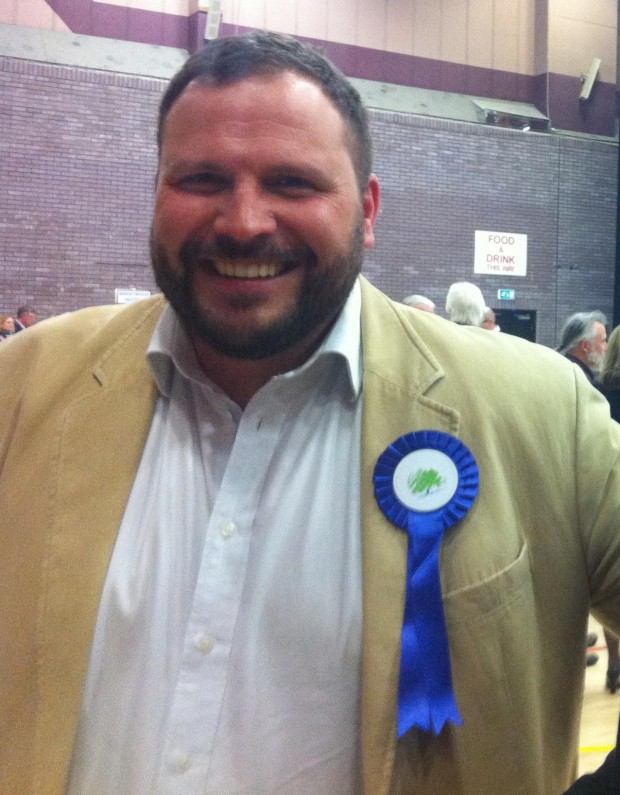 Chris Hossack (Conservative, Brentwood North)[audio:https://www.phoenixfm.com/wp-content/uploads/2013/05/Chris-Hossack.mp3|titles=Chris Hossack]
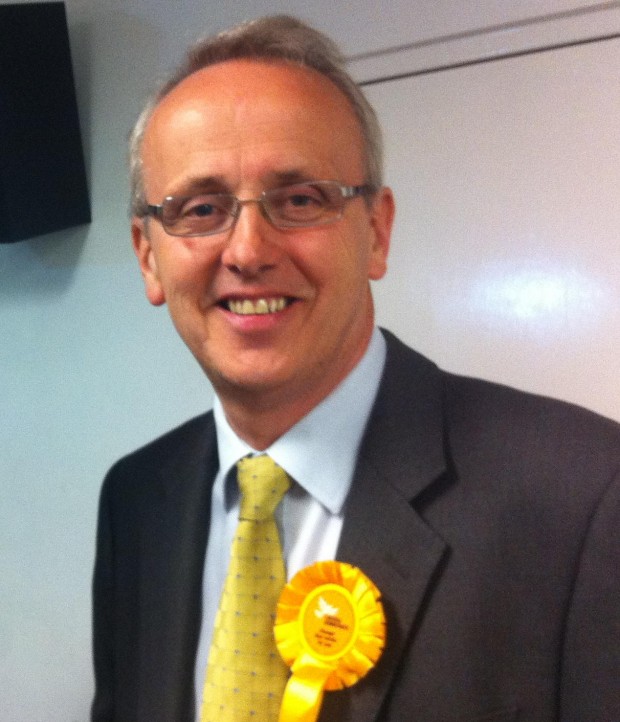 David Kendall (Liberal Democrat, Brentwood South)[audio:https://www.phoenixfm.com/wp-content/uploads/2013/05/David-Kendall.mp3|titles=David Kendall]
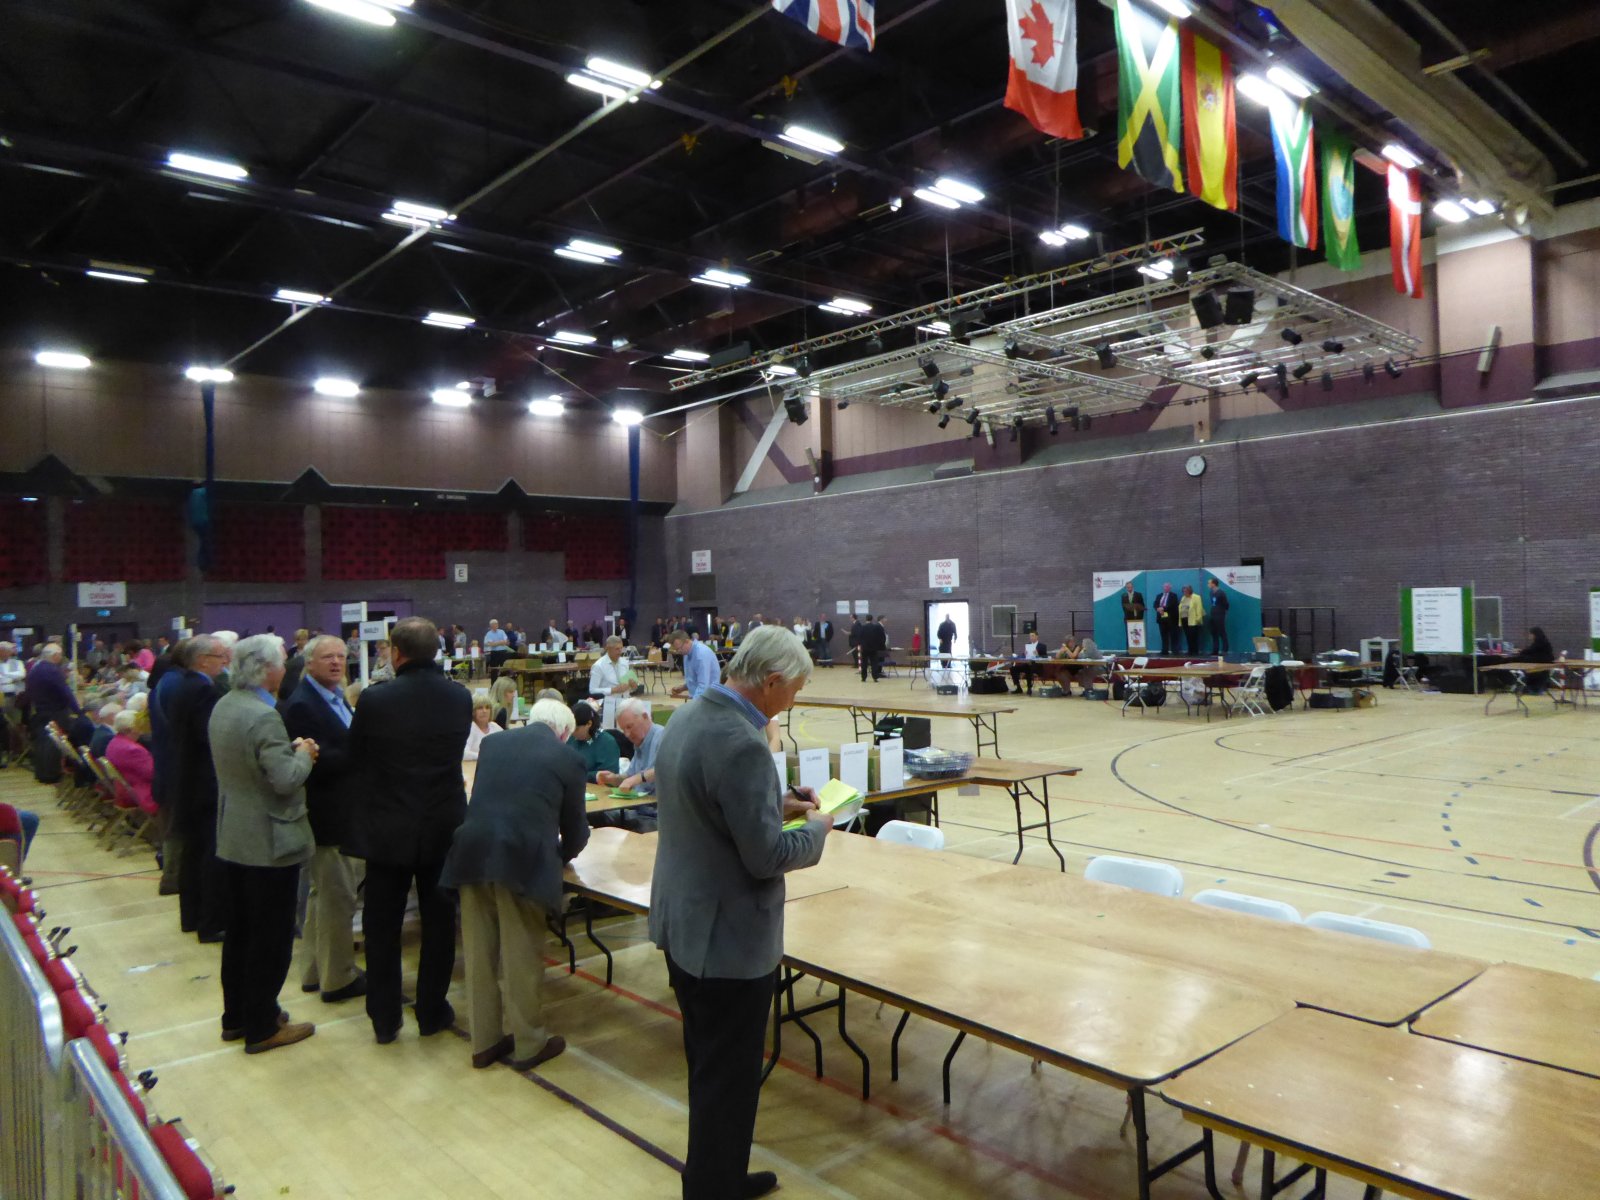
After the results we got reaction from two of the winners as well as further feedback from UKIP:
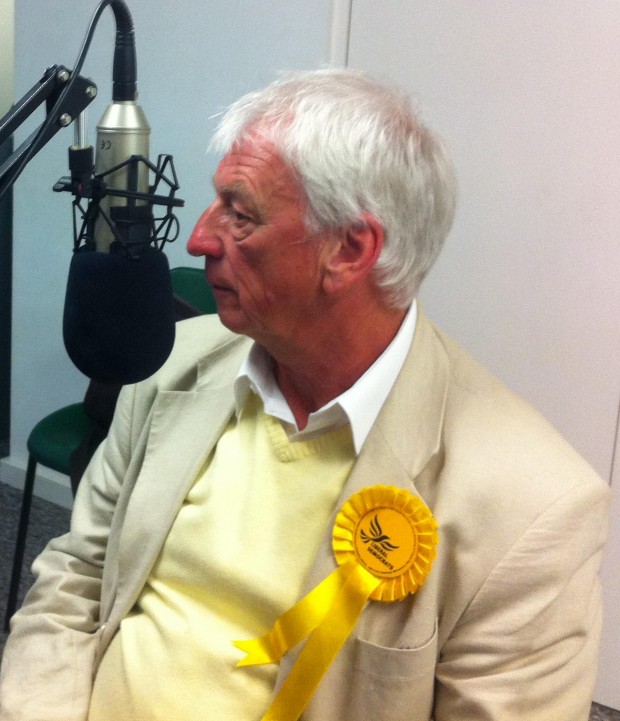 Cllr Barry Aspinell (Liberal Democrat, Brentwood North) & Mick McGough (UKIP)[audio:https://www.phoenixfm.com/wp-content/uploads/2013/05/Barry-Aspinell-Mick-McGough.mp3|titles=Barry Aspinell & Mick McGough]
Cllr Roger Hirst (Conservative, Brentwood Hutton)[audio:https://www.phoenixfm.com/wp-content/uploads/2013/05/Roger-Hirst.mp3|titles=Roger Hirst]
2013 results:
| Brentwood North | |||||
| Barry Roy Aspinell | Liberal Democrat | 1,842 | 43.28% | elected | |
| Chris Hossack | Conservative | 1,169 | 27.47% | ||
| Michael Jack McGough | UKIP | 863 | 20.28% | ||
| Yvonne Waterhouse | Labour | 266 | 6.25% | ||
| Simon Anthony Attwood | Green | 116 | 2.73% | ||
| Total votes cast | 4,256 | ||||
| Brentwood South | |||||
| David John Kendall | Liberal Democrat | 1,626 | 38.88% | elected | |
| Keith Parker | Conservative | 1,117 | 26.71% | ||
| Mark Allen | UKIP | 768 | 18.36% | ||
| Gareth Paul Barrett | Labour | 534 | 12.77% | ||
| Stephanie Bliss | Green | 106 | 2.53% | ||
| Oliver Tilbrook | English Democrats | 31 | 0.74% | ||
| Total votes cast | 4,182 | ||||
| Brentwood Rural | |||||
| Ann Frances Naylor | Conservative | 1,847 | 44.37% | elected | |
| Yvonne Jeanette Maguire | UKIP | 1,425 | 34.23% | ||
| Lisa Penelope Barrett | Liberal Democrat | 461 | 11.07% | ||
| Julie Morrissey | Labour | 304 | 7.30% | ||
| Howard John Bills | Green | 126 | 3.03% | ||
| Total votes cast | 4,163 | ||||
| Brentwood Hutton | |||||
| Roger Charles Hirst | Conservative | 2,053 | 48.02% | elected | |
| David Watt | UKIP | 1,280 | 29.94% | ||
| Mike Le-Surf | Labour | 437 | 10.22% | ||
| Alfred John Newberry | Liberal Democrat | 353 | 8.26% | ||
| David Andrews | Green | 152 | 3.56% | ||
| Total votes cast | 4,275 | ||||
| Billericay and Burstead | |||||
| Anthony Michael Hedley | Conservative | 3,661 | 26.66% | elected | |
| Kay Twitchen | Conservative | 3,523 | 25.65% | elected | |
| Terry Gandy | UKIP | 2,103 | 15.31% | ||
| Susan Patricia McCaffery | UKIP | 1,957 | 14.25% | ||
| Alan Bennett | Labour | 658 | 4.79% | ||
| Santa Nina Bennett | Labour | 563 | 4.10% | ||
| Nigel John Horn | Liberal Democrat | 437 | 3.18% | ||
| Stephen McLaren Watson | Green | 290 | 2.11% | ||
| Nelson Joseph Brunton | Green | 285 | 2.08% | ||
| Martin Keith Howard | Liberal Democrat | 256 | 1.86% | ||
| Total votes cast | 13,733 | ||||
| Crouch | |||||
| Malcolm Robert Buckley | Conservative | 2,661 | 21.22% | elected | |
| Nigel De Lecq Le Gresley | UKIP | 2,396 | 19.11% | elected | |
| Paul John Downes | UKIP | 2,221 | 17.71% | ||
| Don Morris | Conservative | 2,074 | 16.54% | ||
| Iris Pummell | Independent | 966 | 7.70% | ||
| Albert Edward Ede | Labour | 790 | 6.30% | ||
| Andrew Charles Buxton | Labour | 765 | 6.10% | ||
| Poppy Gerrard-Abbott | Green | 191 | 1.52% | ||
| Philip Edward Jenkins | Liberal Democrat | 171 | 1.36% | ||
| Karin Riedl | Green | 167 | 1.33% | ||
| Steve Nice | Liberal Democrat | 137 | 1.09% | ||
| Total votes cast | 12,539 |
2009 results:
| Brentwood North | |||||
| Barry Roy Aspinell | Liberal Democrat | 2,698 | 45.47% | elected | |
| Phil Baker | Conservative | 2,397 | 40.40% | ||
| Michelle Ann Wigram | Labour | 562 | 9.47% | ||
| Carolyn Rossiter | BNP | 276 | 4.65% | ||
| Total votes cast | 5,933 | ||||
| Brentwood South | |||||
| David John Kendall | Liberal Democrat | 2,273 | 41.46% | elected | |
| Lionel Martin Lee | Conservative | 2,266 | 41.33% | ||
| Kevin Swaby | BNP | 501 | 9.14% | ||
| Gareth Paul Barrett | Labour | 443 | 8.08% | ||
| Total votes cast | 5,483 | ||||
| Brentwood Rural | |||||
| Ann Frances Naylor | Conservative | 2,953 | 48.67% | elected | |
| Yvonne Jeanette Maguire | UKIP | 1,300 | 21.42% | ||
| Karen Louise Chilvers | Liberal Democrat | 991 | 16.33% | ||
| Dennis David Norman | Labour | 314 | 5.17% | ||
| Sidney Albert Chaney | BNP | 312 | 5.14% | ||
| Maureen Dallis Davies | English Democrats | 198 | 3.26% | ||
| Total votes cast | 6,068 | ||||
| Brentwood Hutton | |||||
| John Roberts | Conservative | 4,052 | 65.43% | elected | |
| Ross Adam Carter | Liberal Democrat | 1,119 | 18.07% | ||
| Clifford James Houghton | BNP | 602 | 9.72% | ||
| Kees Maxey | Labour | 420 | 6.78% | ||
| Total votes cast | 6,193 | ||||
| Billericay and Burstead | |||||
| Anthony Michael Headley | Conservative | 6,224 | 31.22% | elected | |
| Kay Twitchen | Conservative | 5,021 | 25.18% | elected | |
| Susan Patricia McCaffery | UKIP | 1,721 | 8.63% | ||
| Martin Keith Howard | Liberal Democrat | 1,638 | 8.22% | ||
| Stephen William Nice | Liberal Democrat | 1,519 | 7.62% | ||
| Margaret Mary Viney | Labour | 913 | 4.58% | ||
| Kim Elizabeth Gandy | English Democrats | 795 | 3.99% | ||
| Michael Richard Bateman | BNP | 735 | 3.69% | ||
| Anthony Richard Emrys Borlase | Labour | 717 | 3.60% | ||
| Irene Lillian Bateman | BNP | 656 | 3.29% | ||
| Total votes cast | 19,939 | ||||
| Crouch | |||||
| Don Morris | Conservative | 4,732 | 27.12% | elected | |
| Iris Pummell | Conservative | 4,545 | 26.05% | elected | |
| Ron Long | UKIP | 1,854 | 10.63% | ||
| Anthony Mark Gladwin | BNP | 1,449 | 8.30% | ||
| Philip Edward Jenkins | Liberal Democrat | 1,189 | 6.81% | ||
| Benjamin Paul Williams | Liberal Democrat | 1,045 | 5.99% | ||
| Christopher Roberts | BNP | 947 | 5.43% | ||
| Santa Nina Bennett | Labour | 875 | 5.01% | ||
| Patricia Ann Rackley | Labour | 813 | 4.66% | ||
| Total votes cast | 17,449 |